Analysis of inventories on the example of selected enterprises (pt.3) – results of ABC/XYZ analysis
The results of ABC/XYZ analysis from last publication for the interior trim company, expressed as the number of indexes and the value of inventories in particular groups, are presented in Figures 1 and 2.
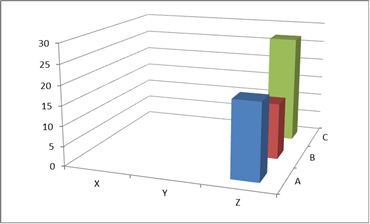
Figure 1. ABC/XYZ analysis results expressed by the number of indexes in particular groups for a company from the interior trim industry.
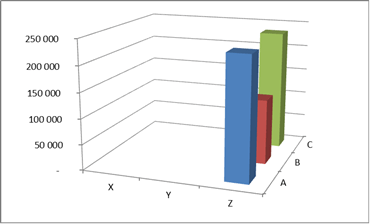
Figure 2. ABC/XYZ analysis results expressed as inventory value for particular groups, for a company from the interior trim industry.
The demand for its products was so volatile that, as part of the XYZ analysis, all products were classified as group Z. The most numerous were AZ and CZ groups. The results of the analysis indicated that the level of inventories in those groups was too high. This was confirmed by the study of the days on hand in different groups, the results of which are shown in Figure 3.
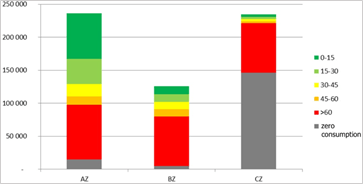
Figure 3. Results of the coverage factor test for the groups with the highest inventory value, for the company from the interior trim industry.
The products in all groups were characterized by an alarmingly low rotation. In each of them there were products with the coverage factor exceeding 60 days. Products classified in the CZ group were characterized almost exclusively by such low rotation or complete lack of consumption.
Taking into account the bad stock structure and demand characteristics described above, the issue of stock management for products with high sales volatility, and in particular products with an exponential or close to exponential sales distribution, was also a key logistics issue for this company.
Figures 4 and 5 present the results of ABC/XYZ analysis for a pharmaceutical company, expressed by the number of indexes and the value of inventories in particular groups. As can be seen from the graphs, the CZ group was the most numerous, characterized by the lowest sales value and the highest variability in consumption. The results of the analysis compiled according to the value of inventories indicate that most inventories were accumulated for groups: AY, AZ and CZ. In order to deepen the analysis, the days on hand for these groups were examined.
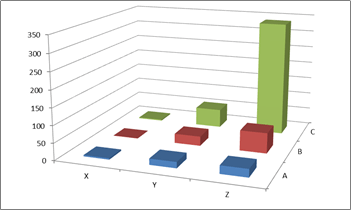
Figure 4.ABC/XYZ analysis results expressed by the number of indexes in particular groups for the pharmaceutical company.
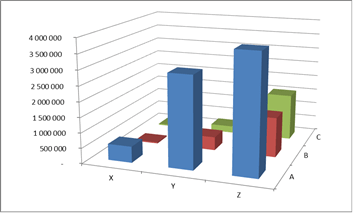
Figure 5. ABC/XYZ analysis results expressed as inventory value for particular groups, for the pharmaceutical company.
The results of the study are shown in Figure 6. The results of the analysis indicate that AY products have relatively low coverage factors, although there are also cases where the days on hand exceed 60 days. The study also indicates that problems with inventory management occur in the AZ and CZ groups with an exponential or close to exponential distribution of sales. In the case of the AZ group, more than half of the indexes had days on hand in excess of 60 days. In the CZ group, almost all products had such a low turnover.
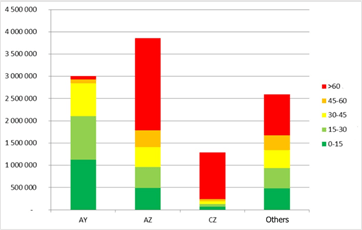
Figure 6. Results of the coverage factor test for the groups with the highest inventory value, for the pharmaceutical company.
Generalizing the results of the research and self-evaluation of enterprises discussed above, it can be concluded that, as a rule, in manufacturing and commercial enterprises, several dozen percent of products stored in warehouses are characterized by sales with an exponential distribution of probability or a distribution close to that of exponential. In addition, those involved in inventory management are relatively good at holding adequate stocks and levels of customer service for products with regular sales. However, the challenge for logisticians is to manage inventories of products with an irregular distribution of sales volumes, in particular products with an exponential or close to exponential distribution, which in the above analyses were classified into group Z.