Another extremely useful tool for inventory management is ABC analysis.
It is based on a regularity observed in the 19th century by the Italian scientist Vilfredo Pareto. His research has shown that 80% of the national wealth in Italy is owned by 20% of families [Maternowska 2000a]. This regularity, called the Pareto principle, is applied in many areas of life. As a rule, about 20% of the activities performed generate about 80% of the effects. As examples of this, dependence in logistic processes can be mentioned [Rutkowski 2005]:
- 80% of customer service time is spent on handling 20% of invoices,
- 80% of quality problems are due to 20% of causes,
- 80% of the sales value is generated by 20% of customers,
- 80% of a company’s costs are generated by 20% of its customers.
ABC analysis, based on the Pareto principle, involves assigning objects from a certain set to one of three groups, distinguished according to the needs of the problem. As examples of the studied objects we can mention [Maternowska 2000b; Twaróg 2003]:
- manufactured, sold and stored products, components, raw materials, assortment groups, etc.,
- suppliers,
- clients,
- the cause of the damage.
Examples of criteria for assigning these objects to particular groups are:
- demand,
- sales,
- production,
- value,
- rotation in the warehouse,
- profits from sales,
- profit related to customer service,
- the cost of customer service,
- frequency of occurrence of the considered phenomenon (e.g. occurrence of damage).
In the classic ABC method, a division into three groups is assumed with regard to the distinguished feature:
- group A constituting 80% of the total value of the measured characteristic, covering 20% of the studied population,
- group B constituting 15% of the total value of the measured characteristic, including 30% of the examined population,
- group C constituting 5% of the total value of the measured characteristic, including 50% of the examined population.
The number and share of the measured characteristic for each group is presented in Table 2.
| Group | Group size in relation to the population size | Total value of the measured characteristic |
| A | 20% | 80% |
| B | 30% | 15% |
| C | 50% | 5% |
In inventory management and material management, ABC analysis is most often conducted in order to determine a different inventory management policy for the products of each group or to assign assortments to specific locations in the warehouse.
In the first case, the division of assortments into ABC groups is made most frequently due to one of the following criteria:
- sales in terms of value,
- quantitative sales,
- the accuracy of forecasting,
- regularity of wear and tear.
If, for example, the value of sales is selected as
an assignment criterion, then:
- group A will be assigned about 20% of products stored in the warehouse, the sale of which brings about 80% of the revenue,
- Group B will be assigned about 30% of products stored in the warehouse, the sale of which brings about 15% of the revenue,
- group C will be allocated approximately 50% of products stored in the warehouse, the sale of which brings about 5% of the revenue.
Dividing products into these categories allows for
a different approach to stock management for each of them. It is then possible to determine different levels of customer service for each of the groups, and thus different levels of security stocks. For each group,
a different stockholding model can also be adopted, focusing on the most selling products while not devoting too much time to marginally selling products.
Similarly, if sales expressed in issue units are taken as the ABC analysis criterion, the analysis will result in product categories with different levels of sales. Products assigned to group A will be characterized by mass sales and, consequently, the highest regularity of sales. Products from group B, and in particular group C, will have a relatively low share in the total level of releases. From the point of view of inventory management, it usually means that if they are not produced for specific orders, forecasting the level of their sales and securing the level of customer service for these products will be extremely difficult.
In order to minimize the risk described above,
an analysis is conducted with regard to two criteria,
i.e. ABC/XYZ analysis. The first analysis is carried out, for example, on the basis of sales value, classifying products into ABC groups. The second, analogous analysis is carried out on the basis of another criterion, for example sales expressed in quantity or regularity of consumption. In this analysis, products are divided into XYZ groups.
The results of both analyses are overlapped, resulting in 9 groups for which a different inventory management policy can be established.
Results of overlapping ABC and XYZ analyses carried out in relation to sales expressed in quantitative terms are presented in Table 3.
| X | Y | Z | |
| A | significant value, mass sales | significant value, average sales volume | significant value, small sales |
| B | average value, mass sales | average value, average sales volume | average value, small sales |
| C | small value, mass sales | small value, average sales volume | small value, small sales |
As a result of using ABC/XYZ method it is possible to precisely analyze sales and stocks of products assigned to each group. As mentioned earlier, it is possible to determine different levels of customer service, level of security stocks and methods of stock renewal for each category. As a result, inventory planners can focus their efforts on products that are relevant to customer needs. The actions described above should also translate into reducing the level and value of inventories and ensuring greater availability of products for customers.
The practical application of the ABC/XYZ analysis is presented in Chapter 3.
The second, often used in warehouse management, application of ABC analysis is assigning assortments to specific locations in the warehouse [Maternowska 2000a]. The ABC analysis is then carried out on the basis of the criterion of the number of issues of cargo units of products from the warehouse. As a result of assigning products to particular groups, when planning the organization of work in
a warehouse, products with the highest turnover (group A) are placed as close as possible to complementary fields, at the bottom of shelves. In addition, easy access to group B products is provided. The worst-rotating products (group C), which constitute about 50% of the stored assortment, are placed further away from the complementary fields and are provided with the possibility of picking. The effect of ABC analysis in this case is lower picking time and shorter routes covered by forklift trucks which translates into lower costs of warehouse work.
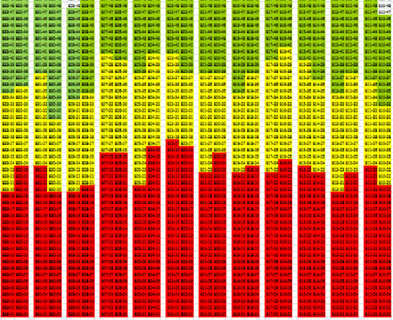
Figure 10 presents an example of a warehouse layout before ABC analysis.

Red color represents group A goods with the highest level of rotation. Yellow color represents group B goods. Green color represents worst-rotating products
(group C). Figure 11 presents the same warehouse layout after ABC analysis has been applied